Requirements Burndown Chart
-
Role
Product Designer & Software Engineer -
Company
Parasoft Corp. -
Date
2015 -
Technologies
JavaScript, D3.js, AJAX
Overview
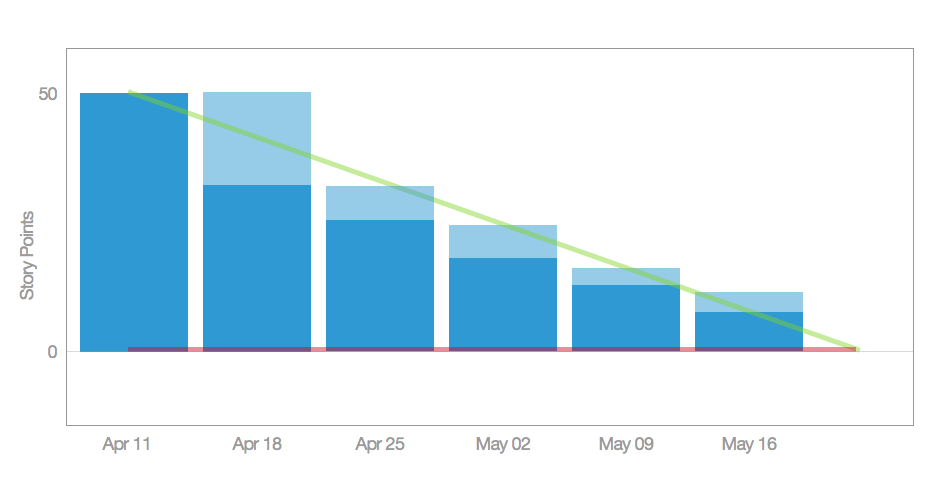
Parasoft’s Development Testing platform included functionality to track user stories. In order to make this information available on the dashboard, we needed a visualization similar to an iteration burndown chart.
Goals
- Keep track of how many story points your team is completing each sprint.
- Keep track of how many story points are added into the release each sprint.
- Predict when the release was going to be completed.
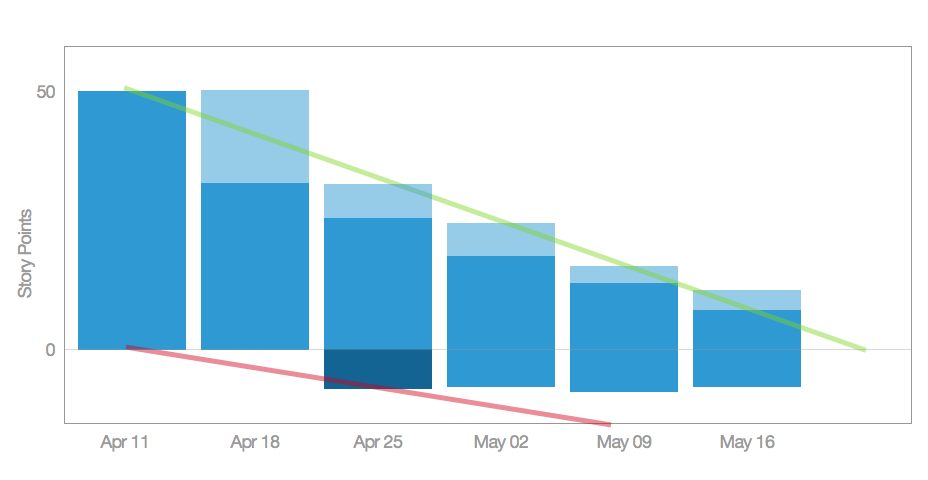
Crunch time
Sometimes there are urgent features that need to be added to the release. The baseline shifts down as more stories are added to the release. This allows separate measures for a teams velocity and the increase in the amount of work.